Logistics: Freight, Sourcing, and Supply Chains
Logistics connects the commodity market to the map. The game projects how a state with unmet input demand would source locally, across state lines, or from abroad after shipping and tariffs. Logistics sectors provide the freight capacity measured by that projection. Heavy haul becomes real Freight commodity demand, so tight capacity raises freight sold volume and price. Electricity and natural gas are the exception: they travel by wire and pipe, spend no freight capacity, and pay distance in transmission loss instead.
The distinction matters: fresh worlds run freight settlement in shadow mode. The haul calculation drives the Freight market, sourcing report, and Logistics map, but it does not cap a sector's sales and moves no money. An admin can switch settlement to active, which does two things together: it caps a state's sales at what the freight network could actually deliver, and it bills the shipping. Buyers in a destination state are charged for their inbound hauls in proportion to the imported inputs they consume, and the same money is credited to the freight-supplying sectors in the origin state, so the charge and the haul revenue stay matched: a transfer between corporations, not a sink. An admin can phase active settlement in over a window of turns; while the ramp runs, both the delivery cap and the shipping bill scale up together and the phase-in fraction is shown on the markets view and the sector Freight tag.
The short version
For a corporation, logistics answers three questions:
- Can the market supply the input locally? Projected local supply fills first and uses no freight capacity.
- If not, where is the cheapest reachable seller? The sourcing projection compares the seller's ask, shipping cost, and tariff.
- What does the route cost? Projected interstate haul consumes freight capacity in the seller's state, and haul past that state's nominal capacity pays a congestion surcharge on top. Capacity is a price rather than a ceiling: the buyer's price tolerance is what finally stops a route. Grid goods skip the haulage fleet entirely.
For a logistics corporation, the practical loop is simpler: open logistics sectors where the map shows heavy haul load or weak freight capacity, then watch the Freight commodity page to see whether the market is short or oversupplied.
Read the Freight commodity page first
The Freight & Transportation page shows the global or exchange-level price, supply, demand, cleared volume, unmet demand, and unsold capacity. The unit is TEU, a container-equivalent measure of transport capacity.
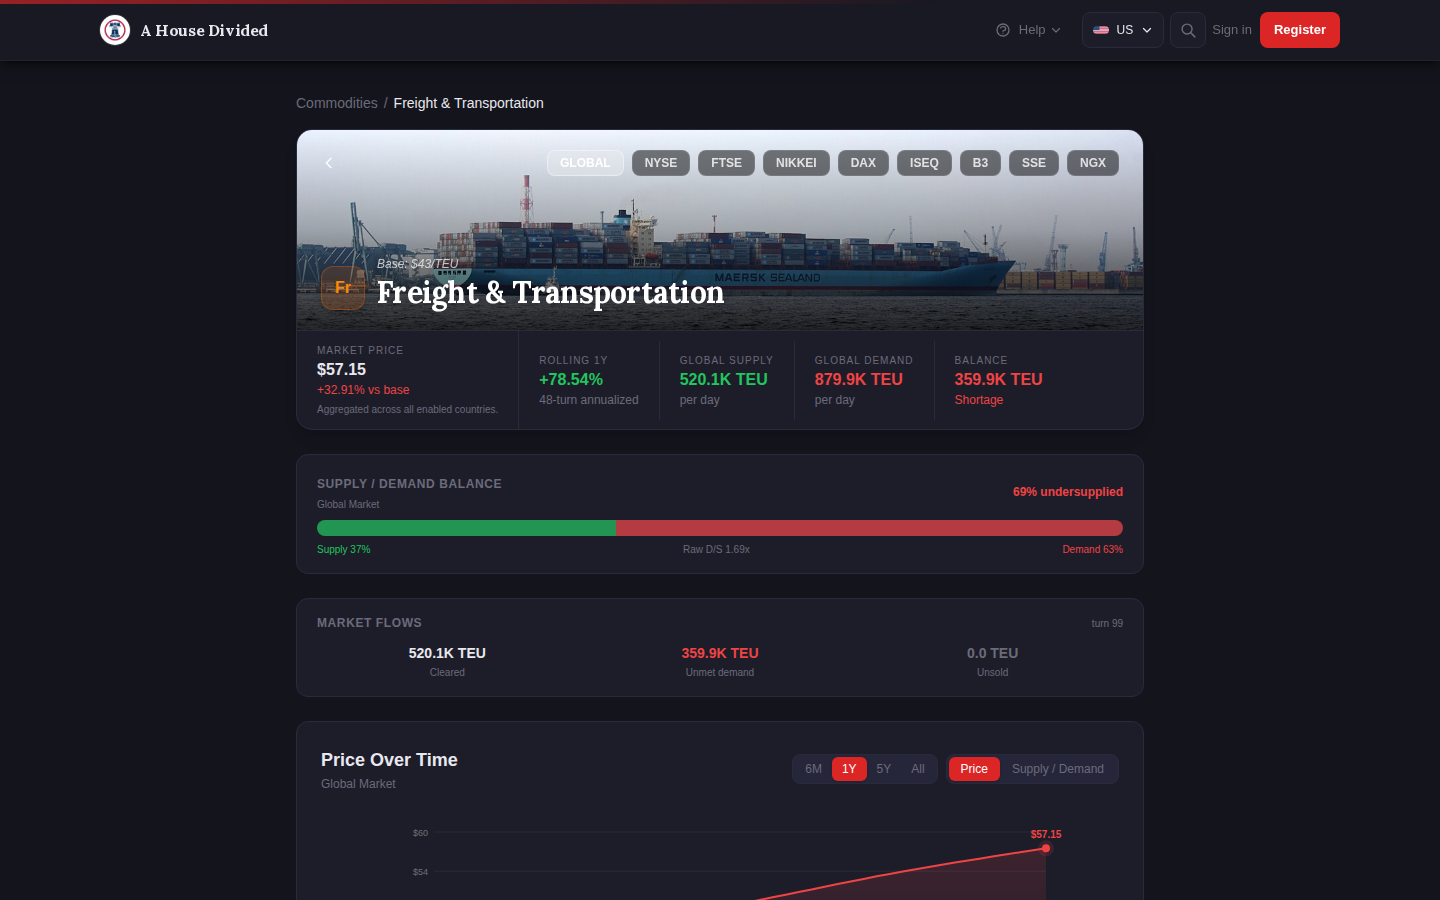
Use the page like this:
- Demand above supply: freight is scarce. Logistics sectors have room to sell more capacity, and shipping becomes more expensive for commodity buyers.
- Supply above demand: some freight capacity is going unsold. Expanding now risks low fill and weak margins.
- Price above base: the shortage has persisted long enough to lift the market price.
- Cleared volume: the amount of freight capacity the market actually used this turn.
Freight is itself a commodity. A logistics sector earns through the freight market just as an energy sector earns through electricity. Interstate haul is booked as demand for that commodity every market turn.
Read the Logistics map second
Open a country's map and select Logistics. Green intensity follows the freight capacity available in each state. Hover a state to see:
- freight capacity in TEU;
- interstate haul per turn;
- utilization;
- the split between bulk and special freight.
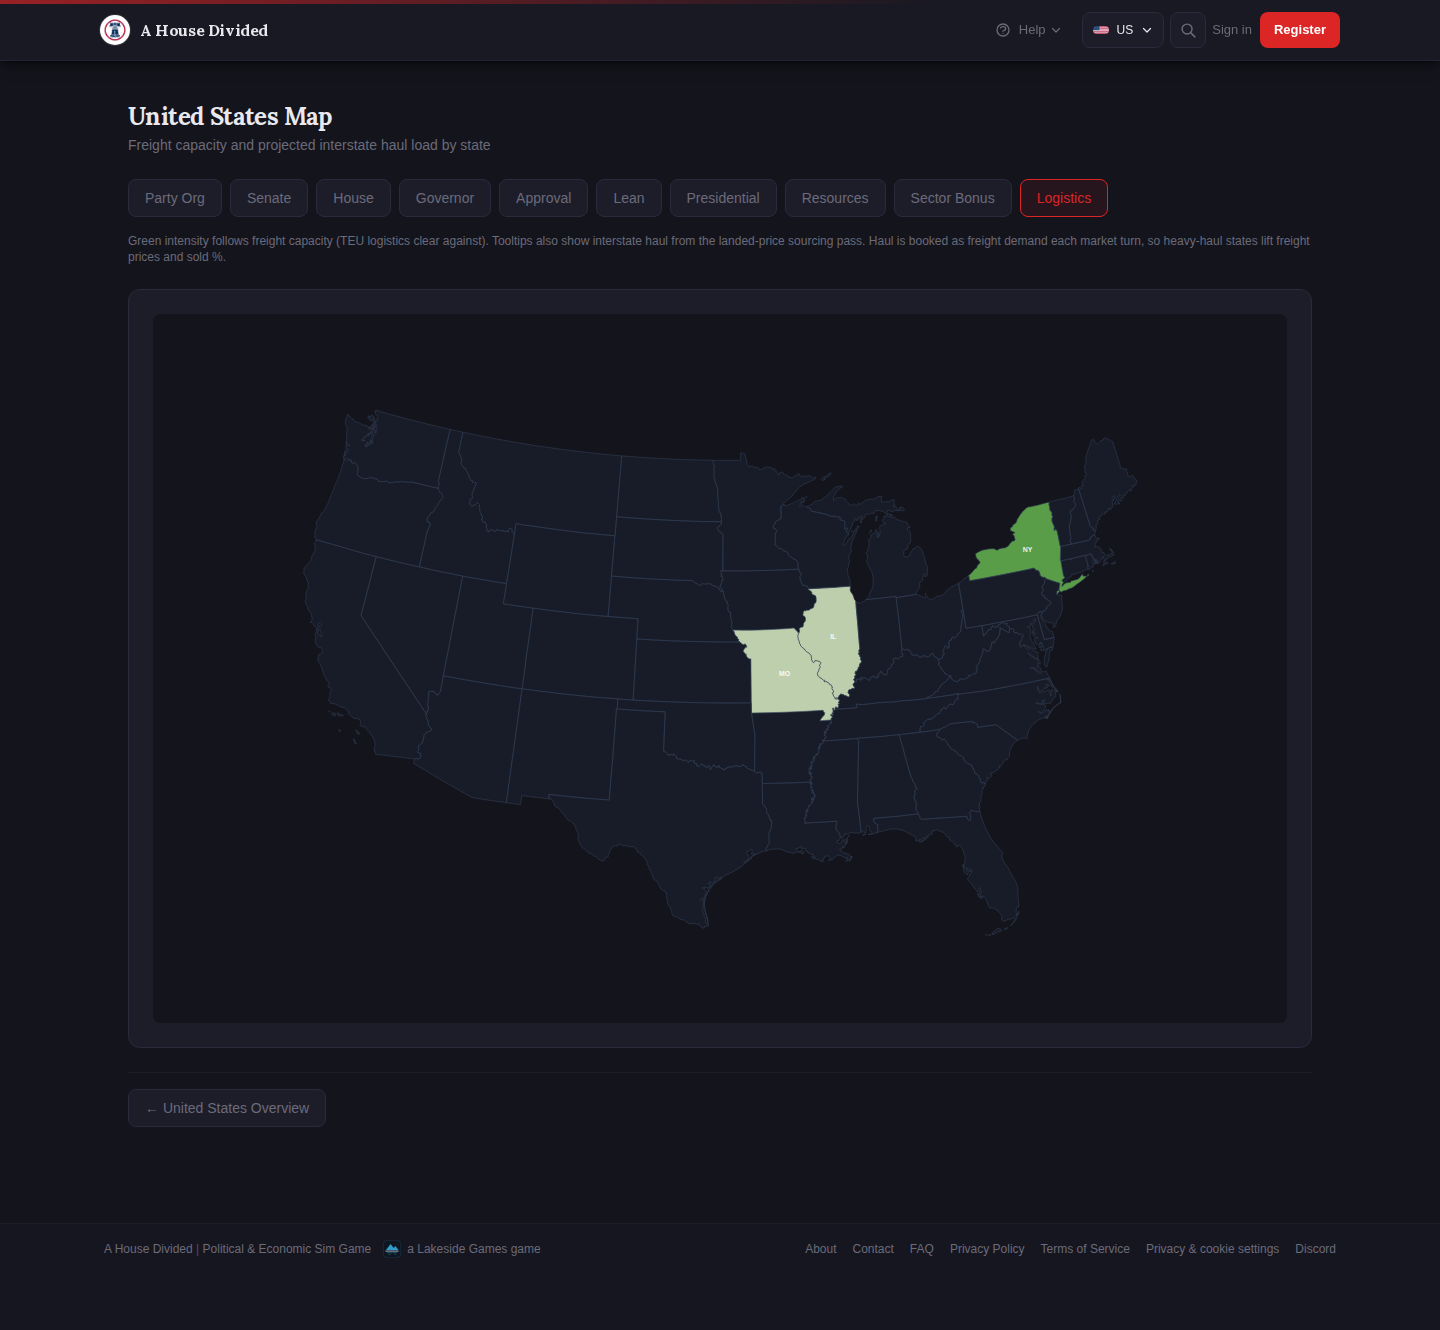
The map and commodity page answer different questions. The commodity page tells you whether freight is scarce overall. The map tells you where the network exists and where domestic haul is loading it.
How sourcing chooses a route
For the haul projection, each state with unmet demand ranks eligible sellers by landed price:
landed price = seller ask + shipping + tariff
The cheapest eligible source fills first, up to three limits:
- the buyer's remaining demand;
- the seller's spare supply;
- the buyer's price tolerance.
Freight capacity is the fourth influence, and it now acts through price rather than as a limit of its own. Bulk and special cargo draw from the same state freight fleet. Haul above that fleet's nominal capacity keeps running at a surcharge, which pushes the landed price toward the tolerance ceiling. A state with no freight supply at all still hauls nothing.
The tolerance ceiling is the local price plus 35%. A technically reachable projected shipment can still be rejected when freight and tariffs make it too expensive. The sourcing report records that amount as unmet, while aggregate commodity clearing remains the source of truth for the commodity market itself.
Imports use a flat 6-hop sea equivalent for landed-price comparison. Domestic states with no modeled route use the same fallback. Embargoes remove a route entirely; tariffs leave it open but make it more expensive.
The three freight classes
Every shipped commodity belongs to one of three classes. Two of them ride the same haulage fleet and spend a state's freight capacity. The third does not.
| Class | Capacity TEU per unit-hop | Shipping-price weight per unit-hop | Typical cargo |
|---|---|---|---|
| Bulk | 0.04 | 0.004 | Heavy raw materials and ordinary physical goods |
| Special | 0.12 | 0.012 | Higher-care or specialized cargo |
| Grid | 0 | 0 | Electricity and natural gas |
Special cargo consumes more TEU per unit per hop, but it does not have a separate reserved pool. Bulk and special loads share every available TEU in the state. The map tooltip separates the two loads so you can see what is using the fleet, not because one class is forbidden from using capacity left idle by the other.
Capacity load and shipping price use separate weights. The capacity weight keeps real haul visible on the Logistics map; the smaller shipping-price weight converts the freight-market price into the charge buyers compare with the cargo price. Raising network load therefore does not automatically multiply every shipping bill by the same amount.
Grid: wire and pipe
Electricity and natural gas are delivered by wire and pipe. They cross state lines like anything else, but they never draw on the haulage fleet and never create Freight demand. Distance still costs, in two ways:
- Transmission loss. Every state line crossed loses 3% of the units dispatched. A 6-hop haul delivers about 83% of what was sent, so the seller draws down more than the buyer receives.
- A wheeling charge. Every crossing adds 2% of the seller's ask to the landed price. The charge is priced off the seller, not off the freight market, so a freight shortage does not raise the cost of power.
There is no capacity ceiling on a grid route, so a state short of power can always import it at a price. Loss and wheeling are what keep distant generation behind local generation in the landed-price sort. Generation sited far from load still sells; it sells at a discount for the distance.
When the network is congested
Freight capacity sets a price, not a ceiling. Once combined bulk and special haul in a state passes the fleet's nominal capacity:
- the network keeps moving goods up to 1.5x that nominal capacity;
- every unit above nominal pays a 35% surcharge on the shipping leg of its landed price;
- the buyer's tolerance ceiling ends the flow. If the surcharged landed price breaks the ceiling, the overflow does not move and the demand is recorded as unmet on price rather than on capacity.
A short haul into a congested state usually still clears, because the surcharge falls on a small shipping leg. A long haul into the same state prices itself out. A state with no freight supply of its own hauls nothing at any price.
Because haul can now run past nominal capacity, a state's load can exceed its capacity. That is congestion, and the units above capacity are the ones paying the surcharge. Sustained congestion in a state is a standing signal for a logistics CEO: the haul is real Freight demand, and the last units of it are moving at a premium.
When active settlement limits delivery
When an admin enables active freight settlement, a sector's clearing offer is capped by what the freight network could actually place. Output that no route could carry to a buyer is not counted as a sale, and the sector reports the share of its offered output that was produced and could not be delivered. When that share is meaningful, the sector row carries a Freight tag and the sector page states how many units had no freight to carry them. In the fresh-world shadow configuration, these route limits are measured without reducing sales.
That splits one bad number into two different instructions:
- Low selling %, small delivery-limited share. The market did not want the goods. Change price, cut output, or move the sector toward a commodity in demand.
- Low selling %, large delivery-limited share. Buyers exist and the goods could not reach them. Add freight capacity out of that state, by opening a logistics sector there yourself or buying into one, or site new production closer to the demand you sell into.
The second case is a route problem, so check the Logistics map for the origin state before touching production. A thin freight network strands whatever is built behind it, however healthy the national commodity balance looks.
What a logistics CEO should do
Before opening a sector
- Open the Freight commodity page and check the exchange where you plan to operate.
- Open the country map in Logistics mode.
- Look for a state with low capacity, meaningful haul, and an undersupplied freight market.
- Check the target state's local business conditions and your corporation's type match.
- Build only enough capacity to fit visible demand. Capacity arrives gradually and idle plants still cost money.
After opening a sector
- If active settlement is enabled, watch selling % on the sector page together with the Freight tag beside it. Low selling with no Freight tag means the market does not need the output. Low selling with a Freight tag means the output could not get out of the state.
- Watch the Logistics map after each market turn. New industrial capacity can create new haul demand.
- Compare your freight price with the cost of inputs used by physical industries. A freight shortage can raise costs across manufacturing, agriculture, chemicals, , and construction.
- Use a focused logistics strategy only when its output and input mix match the shortage you are trying to serve.
Freight capacity and corporate logistics strength are different
These names are easy to confuse:
- Freight capacity is market output from logistics sectors. It moves goods between states and appears on the commodity page and Logistics map.
- Corporate logistics strength is an internal corporation stat built by the CEO's logistics budget. It reduces the sprawl penalty from operating many sectors.
Spending on corporate logistics strength does not create TEU. Opening and operating a logistics sector does.
Common mistakes
Building where the map is dark without checking demand. A dark state may have no freight network because it has little industry and little haul. Check the commodity balance too.
Treating global freight shortage as proof every state is profitable. Sector economics are still local, national, and global. Check the exchange and state before building.
Assuming imports use domestic freight capacity. Overseas supply affects landed price through the sea-hop cost and tariffs, but it does not consume an origin state's domestic freight pool.
Expecting electricity to need trucks. Grid commodities cross state lines without touching freight capacity, so a power sector in a state with a thin freight network can still sell outside it. It pays transmission loss and a wheeling charge instead.
Reading a delivery-limited sector as weak demand. Output that could not be delivered and output nobody wanted look the same on selling % alone. Check the delivery-limited share before cutting production, because the two call for opposite responses.
Reading projected routes as settled commodity transfers. The route calculation measures haul and creates Freight demand. Aggregate commodity clearing still determines commodity supply, demand, and margin effects.
Expecting a per-route shipping invoice in shadow mode. Under shadow settlement logistics corporations earn only through freight commodity sales: haul raises freight demand and therefore sold volume and price. Under active settlement a real shipping charge is apportioned onto buyer sectors and credited to origin-state freight sectors each turn, but it lands as a per-turn billing line, not as a player-to-player invoice per route.
Related
- Commodities: supply, demand, clearing, and prices.
- Running a Corporation under the Plants System: capacity, fill, build queues, and break-even.
- Supply Agreements: contracted supply before open-market clearing.
- Tariffs: how trade barriers change landed cost and margins.
- International Trade: cross-border clearing, embargoes, and trade balances.